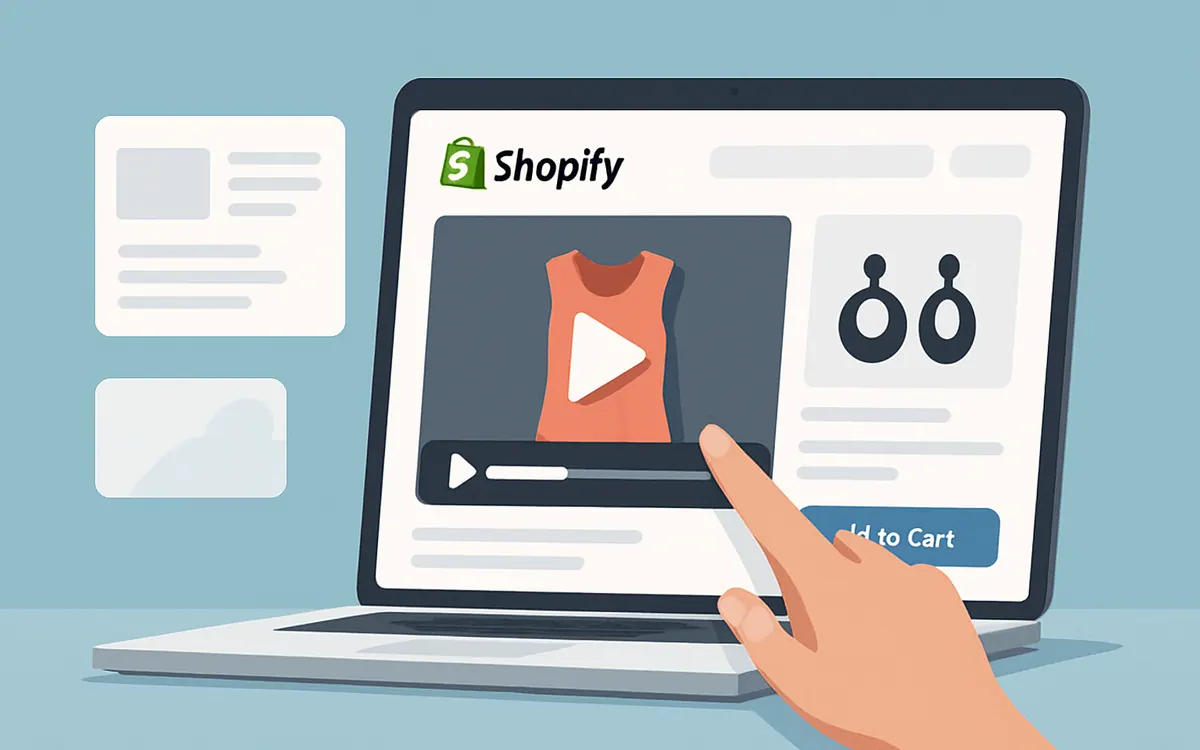
To measure revenue from shoppable videos on Shopify, track the complete customer journey from video impression to purchase:
Video impression
→ Video view
→ Product click
→ Add to cart
→ Checkout
→ Purchase
Then connect video-attributed orders with net sales, product costs, and campaign expenses.
The most important metrics are:
- Video view rate
- Product click-through rate
- Video add-to-cart rate
- Video-assisted purchase rate
- Attributed net sales
- Attributed gross profit
- Return on video investment
Do not judge a shoppable-video strategy by views alone.
A video with 100,000 views and no profitable orders is weaker than a video with 2,000 views that produces 30 high-margin customers.
The goal is not attention. The goal is profitable customer action.
What Is Shoppable Video Revenue Attribution?
Shoppable video revenue attribution is the process of estimating how much revenue or gross profit resulted from customers interacting with a video.
The word estimating matters.
A shopper might:
- Watch a homepage video.
- Click a product.
- Leave the store.
- Return through Google two days later.
- Complete the purchase.
Did the video create the sale?
It probably influenced the purchase, but a last-click report may credit Google because that was the customer's final tracked visit.
This is why video measurement should use more than one attribution view.
Useful categories include:
- Direct video conversion: The shopper purchases during the same session after interacting with the video.
- Video-assisted conversion: The shopper interacts with a video and purchases during a later session.
- Video-influenced conversion: The shopper is exposed to a video but does not necessarily click before purchasing.
- Incremental conversion: The purchase likely would not have happened without the video.
Direct attribution is easiest to measure.
Incremental attribution is the most valuable—but also the most difficult to prove.
The Shoppable Video Measurement Funnel
Measure each stage separately.
| Funnel stage | What it tells you |
|---|---|
| Widget impression | The video was available to be seen |
| Video view | The shopper started watching |
| Video completion | The shopper consumed most or all of the content |
| Product click | The video created product interest |
| Add to cart | The shopper took a buying action |
| Checkout started | The shopper moved toward payment |
| Purchase completed | The order was placed |
| Gross profit | The sale created profit before operating expenses |
Shopify provides standard customer events for actions such as product views, products added to cart, checkout starts, and completed checkouts through its Web Pixels API.
A shoppable-video app may track the earlier video-specific actions, while Shopify Analytics, pixels, or another analytics platform measures later commerce events.
Hyper Shoppable Videos currently lists analytics for:
- Video views
- Product clicks
- Add-to-cart events
Its public listing does not currently claim complete purchase-level revenue attribution.
That means merchants should connect video engagement data with Shopify sales data rather than assuming an app's add-to-cart count equals revenue.
Step 1: Decide What Business Question You Are Answering
Do not start by collecting every possible metric.
Start with one question.
Examples:
- Do product-page videos increase add-to-cart rate?
- Which video generates the most product clicks?
- Does homepage UGC increase product discovery?
- Do video viewers purchase more often than non-viewers?
- Does shoppable video increase average order value?
- Does a complete-the-look video increase multi-product orders?
- Does the gross profit generated exceed the app and production cost?
Each question requires a different test.
Example: Product-page conversion question
Question:
Does adding one demonstration video increase add-to-cart rate on this product page?
Primary metric:
- Product-page add-to-cart rate
Secondary metrics:
- Video view rate
- Product clicks
- Purchase conversion rate
- Gross profit per visitor
Example: Complete-the-look question
Question:
Does a multi-product outfit video increase order value?
Primary metric:
- Average order value among video-engaged sessions
Secondary metrics:
- Products per order
- Video product clicks
- Cross-sell add-to-cart rate
- Gross profit per order
Choose one primary metric before publishing the video.
Otherwise, a weak implementation can always be declared successful using whichever vanity metric increased.
Step 2: Record a Baseline Before Adding Video
You cannot measure improvement without knowing what happened before the video was added.
Record at least:
- Page visits
- Add-to-cart rate
- Checkout-start rate
- Purchase conversion rate
- Average order value
- Net sales
- Gross profit
- Mobile conversion rate
- Desktop conversion rate
Use the same page, product, traffic source, and comparable time period where possible.
Example baseline
For one Shopify product page over 30 days:
| Metric | Baseline |
|---|---|
| Product-page visits | 10,000 |
| Add-to-cart actions | 600 |
| Add-to-cart rate | 6% |
| Orders | 200 |
| Purchase conversion rate | 2% |
| Average order value | $70 |
| Net sales | $14,000 |
| Gross profit per order | $28 |
| Total gross profit | $5,600 |
After adding video, compare the same metrics.
Do not compare a normal February with Black Friday week and attribute the difference to video.
Account for:
- Promotions
- Traffic changes
- Inventory
- Pricing
- Seasonality
- Theme changes
- Advertising changes
- Shipping offers
- Product reviews
- Other apps
The cleaner the comparison, the more useful the conclusion.
Step 3: Track Video Impressions and Views
A video impression usually means the widget or video was loaded or displayed.
A video view may mean:
- Playback started
- The video became visible
- The shopper watched for a minimum number of seconds
- The shopper watched a specified percentage
Definitions vary by app.
Before comparing apps or campaigns, verify exactly how each system defines:
- Impression
- Unique impression
- View
- Engaged view
- Completion
- Click
A four-second view is not the same as a video loading for half a second.
Video View Rate
Video view rate =
Video views ÷ Widget impressions × 100
Example:
- Widget impressions: 8,000
- Video views: 2,400
2,400 ÷ 8,000 × 100 = 30%
A low view rate may indicate:
- Poor placement
- Weak thumbnail
- Unclear play control
- Slow loading
- Low relevance
- The shopper does not need video at that stage
Do not automatically create more videos. Fix the reason shoppers ignore the current one.
Video Completion Rate
Video completion rate =
Completed video views ÷ Video starts × 100
Example:
- Video starts: 2,400
- Completed views: 960
960 ÷ 2,400 × 100 = 40%
Completion rate is useful, but context matters.
A shopper may understand a demonstration after five seconds and click the product before completing the video. That can be a better outcome than watching to the end without taking action.
Step 4: Track Product Clicks
Product clicks show whether video attention becomes product interest.
A click might open:
- A product card
- A product-detail overlay
- A product page
- A variant selector
- An add-to-cart interface
Video Product Click-Through Rate
Video product click-through rate =
Product clicks from video ÷ Video views × 100
Example:
- Video views: 2,400
- Product clicks: 240
240 ÷ 2,400 × 100 = 10%
Diagnose a low click-through rate
Possible causes include:
- The product is difficult to identify.
- Product tags are hidden.
- The CTA is unclear.
- The video is entertaining but not commercially relevant.
- The product appears too late.
- The wrong product is tagged.
- Too many products create choice overload.
Diagnose a high click-through rate with weak sales
The video may be doing its job.
The next constraint could be:
- Product price
- Product-page clarity
- Variants
- Inventory
- Shipping cost
- Delivery time
- Returns policy
- Trust
- Product-market fit
Do not blame the video for problems that occur after the click.
Step 5: Track Add-to-Cart Events
Shopify's standard product_added_to_cart event records when a customer adds a product to the cart on the online store.
A shoppable-video app may also record add-to-cart actions initiated directly from its widget.
Compare these numbers carefully.
An app-specific add-to-cart event may represent:
- A product added directly through the video
- A click on an add-to-cart control
- A cart action attached to the video session
Shopify's broader event may include all add-to-cart actions across the page.
Video Add-to-Cart Rate
Video add-to-cart rate =
Video-attributed add-to-cart actions ÷ Video views × 100
Example:
- Video views: 2,400
- Video-attributed carts: 96
96 ÷ 2,400 × 100 = 4%
Product Click-to-Cart Rate
Product click-to-cart rate =
Video-attributed carts ÷ Product clicks × 100
Example:
- Product clicks: 240
- Video-attributed carts: 96
96 ÷ 240 × 100 = 40%
This metric helps separate video relevance from product-page performance.
- Low click rate: Video or CTA problem
- High click rate, low cart rate: Product, price, variant, or page problem
- High cart rate, low purchase rate: Checkout or offer problem
Step 6: Track Checkout Starts and Purchases
Shopify provides standard events for checkout_started and checkout_completed through its customer-event infrastructure.
The checkout_completed event generally records one completion per checkout. Shopify notes that it may not fire if the page where the event should occur fails to load.
That is one reason no single tracking source should be treated as perfect.
Use multiple checks:
- Shopify orders
- Shopify sales reports
- App analytics
- Shopify customer events
- GA4 ecommerce events
- Campaign-specific reports
Video View-to-Purchase Rate
Video view-to-purchase rate =
Video-attributed purchases ÷ Video views × 100
Example:
- Video views: 2,400
- Attributed purchases: 36
36 ÷ 2,400 × 100 = 1.5%
Video Click-to-Purchase Rate
Video click-to-purchase rate =
Video-attributed purchases ÷ Product clicks × 100
Example:
- Product clicks: 240
- Attributed purchases: 36
36 ÷ 240 × 100 = 15%
Video Cart-to-Purchase Rate
Video cart-to-purchase rate =
Video-attributed purchases ÷ Video-attributed carts × 100
Example:
- Video-attributed carts: 96
- Attributed purchases: 36
36 ÷ 96 × 100 = 37.5%
A weak cart-to-purchase rate may point to:
- Unexpected shipping costs
- Slow delivery
- Missing payment options
- Checkout errors
- Discount-code friction
- Low trust
- Poor mobile checkout experience
Step 7: Calculate Attributed Revenue
Gross sales, total sales, and net sales are not identical.
For evaluating video performance, net sales is generally more useful than gross sales because it reflects discounts and sales reversals more accurately.
Shopify defines gross profit as net sales minus product cost in its sales reporting.
Attributed Net Sales
Attributed net sales =
Sum of net sales from video-attributed orders
Example:
- Video-attributed orders: 36
- Average net sales per attributed order: $68
36 × $68 = $2,448
Do not use total order value blindly when:
- The order includes unrelated products
- Shipping and taxes are included
- Discounts are substantial
- Returns are common
- The video promoted only one item in a larger order
You may need to distinguish:
- Total order sales
- Sales from video-tagged products
- Sales from all products purchased after video engagement
Each tells a different story.
Direct Product Revenue
Direct product revenue =
Quantity of video-tagged products sold × Net selling price
Video-Assisted Order Revenue
Video-assisted order revenue =
Net sales from orders placed after a qualifying video interaction
The second number is broader and usually higher.
Label the metric clearly so readers do not confuse direct product sales with all order revenue.
Step 8: Calculate Gross Profit
Revenue is not profit.
A video can generate high sales while promoting:
- Low-margin products
- Deep discounts
- Expensive-to-ship products
- High-return items
- Products requiring costly fulfillment
Shopify's sales reports define gross profit as net sales minus product cost.
Shopify's finance reporting also notes that only sales with product costs recorded can contribute correctly to cost-of-goods-sold and gross-profit reporting.
Record an accurate cost per item for your products before relying on gross-profit reports.
Video-Attributed Gross Profit
Video-attributed gross profit =
Attributed net sales - Cost of goods sold
Example:
- Attributed net sales: $2,448
- Cost of goods sold: $1,224
$2,448 - $1,224 = $1,224 gross profit
Gross Margin
Gross margin =
Gross profit ÷ Net sales × 100
Example:
$1,224 ÷ $2,448 × 100 = 50%
Two videos can generate the same sales but very different profit.
| Video | Attributed net sales | Gross margin | Attributed gross profit |
|---|---|---|---|
| Video A | $5,000 | 20% | $1,000 |
| Video B | $3,000 | 50% | $1,500 |
Video B creates more gross profit despite producing less revenue.
Step 9: Calculate Total Video Cost
Include all direct costs required to operate the video system.
Possible costs include:
- Video app subscription
- Usage overages
- Creator fees
- Editing
- Production
- Staff time
- Agency fees
- Equipment
- Music licensing
- UGC rights
- Landing-page development
- A/B testing software
Total Monthly Video Cost
Total video cost =
App + Production + Editing + Creators + Staff + Other direct costs
Example:
| Cost | Monthly amount |
|---|---|
| App subscription | $49 |
| Video editing | $200 |
| Creator usage rights | $300 |
| Staff management | $150 |
| Total | $699 |
Do not ignore internal labor because no invoice was issued.
Ten hours of staff time still has a cost.
Step 10: Calculate Return on Video Investment
Video Contribution
Video contribution =
Video-attributed gross profit - Total video cost
Example:
- Video-attributed gross profit: $1,224
- Total video cost: $699
$1,224 - $699 = $525 contribution
Return on Video Investment
Return on video investment =
(Video-attributed gross profit - Total video cost)
÷ Total video cost × 100
Example:
($1,224 - $699) ÷ $699 × 100
= 75.1%
The estimated return on video investment is 75.1%.
This calculation is only as accurate as the attribution and product-cost data behind it.
Break-Even Orders
Break-even orders =
Total video cost ÷ Gross profit per attributed order
Example:
- Total video cost: $699
- Gross profit per attributed order: $34
$699 ÷ $34 = 20.56
The video system needs approximately 21 incremental orders to cover its direct cost.
The important word is incremental.
Orders that would have happened anyway should not be counted as new profit created by video.
Direct, Assisted, and Incremental Attribution
Direct Attribution
Credit the video when the customer:
- Watches or clicks the video.
- Adds a product to cart.
- Purchases in the same session.
Advantages:
- Easy to understand
- Strong connection
- Lower risk of over-crediting
Limitations:
- Misses delayed purchases
- Misses cross-device journeys
- Misses customers who watch but do not click
Assisted Attribution
Credit the video when the customer interacts with it and purchases later within a defined window.
Possible windows include:
- Same day
- 7 days
- 14 days
- 30 days
Advantages:
- Captures longer buying cycles
- Better for considered purchases
Limitations:
- More likely to overlap with other channels
- Attribution becomes less certain over time
Incremental Attribution
Estimate the difference between:
- Shoppers exposed to video
- Comparable shoppers not exposed to video
This is the strongest way to estimate whether video caused additional sales.
A/B testing is one method:
- Version A: Page without shoppable video
- Version B: Same page with shoppable video
Keep other elements constant.
Compare:
- Add-to-cart rate
- Purchase conversion rate
- Gross profit per visitor
- Average order value
- Return rate
Worked Incrementality Example
Version A receives 20,000 visitors:
- Purchase conversion rate: 2.0%
- Orders: 400
- Gross profit per order: $25
- Total gross profit: $10,000
Version B receives 20,000 visitors:
- Purchase conversion rate: 2.2%
- Orders: 440
- Gross profit per order: $25
- Total gross profit: $11,000
Estimated incremental result:
440 - 400 = 40 incremental orders
40 × $25 = $1,000 incremental gross profit
If the video cost $400:
$1,000 - $400 = $600 estimated incremental contribution
This is stronger evidence than claiming every order placed by a video viewer was caused by the video.
Shopify Attribution Models
Shopify reports can use different attribution models when sales metrics and marketing dimensions are combined.
ShopifyQL currently supports:
- Last-click attribution
- First-click attribution
- Any-click attribution
- Last non-direct click attribution
- Linear attribution
Last-click attribution
Credits the final tracked click before the sale.
Useful for:
- Understanding the closing channel
- Short buying journeys
Weakness:
- May ignore earlier video influence
First-click attribution
Credits the first tracked click.
Useful for:
- Understanding discovery
Weakness:
- May ignore the channel or experience that completed the sale
Any-click attribution
Associates sales with channels that participated in the journey.
Useful for:
- Understanding assisted influence
Weakness:
- Several channels may receive credit
Linear attribution
Distributes credit across participating touchpoints.
Useful for:
- Longer customer journeys
Weakness:
- Assumes touchpoints deserve equal credit
Do not search for one "correct" model.
Use several models to understand how the answer changes.
Using Shopify Analytics
Shopify Analytics lets merchants customize reports by changing:
- Metrics
- Dimensions
- Filters
- Date ranges
- Comparisons
- Attribution models
Merchants can save edited reports as custom data explorations and export report data for further analysis.
Useful Shopify reports include:
- Sales by product
- Sales over time
- Sessions by landing page
- Sessions by referrer
- Online store conversion reports
- Profit reports
- Marketing attribution reports
Shopify's acquisition reports display visitor information, while sales-by-referrer reporting is needed when you want converted sales rather than traffic alone.
Do not confuse sessions with sales.
Using Google Analytics 4
Shopify supports setting up Google Analytics 4 through the Google & YouTube channel.
After GA4 is configured, certain ecommerce events can be collected automatically, including actions such as viewing products, adding products to cart, and completing purchases.
For shoppable video, consider creating consistent events such as:
video_widget_impressionvideo_startedvideo_completedvideo_product_clickedvideo_add_to_cart
Useful event parameters might include:
- Video ID
- Video title
- Widget ID
- Widget placement
- Product ID
- Product handle
- Page type
- Creator
- Campaign
- Video format
Example:
event_name: video_product_clicked
video_id: demo_001
placement: product_page_below_gallery
product_id: 123456
creator: customer_ugc
campaign: summer_launch
Consistent naming makes it possible to compare videos and placements later.
Avoid changing event names every month.
Using Shopify Pixels and Customer Events
Shopify's Web Pixels API allows apps and custom pixels to subscribe to customer events in a controlled environment.
Standard events include:
- Page viewed
- Product viewed
- Product added to cart
- Cart viewed
- Checkout started
- Checkout completed
- Search submitted
A custom video implementation may publish its own video events and connect them with standard Shopify commerce events.
This is technical work.
Use an experienced Shopify developer when purchase-level attribution requires:
- Custom event schemas
- Video session identifiers
- Server-side storage
- Cross-session matching
- Custom dashboards
- App-pixel development
Do not paste random tracking code into the theme and assume it is reliable.
Test Your Pixels
Shopify provides Pixel Helper tools to test app pixels and customer events in real time.
Before trusting the data, test:
- Video impression
- Video start
- Product click
- Add to cart
- Checkout start
- Test purchase
- Refund or cancellation behavior
Check whether:
- Events fire once
- Events fire on mobile
- Event parameters are correct
- Product IDs match
- Duplicate pixels exist
- Consent settings affect collection
- Checkout events are received
Duplicate tracking can make a campaign appear twice as successful as it really is.
Privacy and Consent
Tracking requirements depend on:
- Customer location
- Data collected
- Analytics provider
- Advertising use
- Applicable privacy laws
Shopify lets merchants manage privacy policies, cookie banners, data-sharing preferences, and regional privacy settings.
Some pixels may wait for customer consent before collecting data.
That means analytics can undercount visitors who:
- Reject cookies
- Use privacy tools
- Block scripts
- Move between devices
- Use browsers that limit tracking
Do not secretly compensate by using invasive tracking.
Use compliant systems and disclose material data collection.
This section is operational guidance, not legal advice.
Create a Shoppable Video Dashboard
Track performance by:
- Video
- Product
- Page
- Placement
- Creator
- Device
- Traffic source
- Campaign
- Date
Recommended columns:
| Metric | Purpose |
|---|---|
| Widget impressions | Exposure |
| Video views | Initial engagement |
| Completion rate | Content consumption |
| Product clicks | Product interest |
| Add-to-cart actions | Buying intent |
| Purchases | Sales outcome |
| Net sales | Revenue after discounts and returns |
| COGS | Direct product cost |
| Gross profit | Economic value |
| Video cost | Operating cost |
| Contribution | Profit after video cost |
| Return on video investment | Efficiency |
Example Dashboard
| Video | Views | Clicks | Carts | Orders | Net sales | Gross profit | Cost | Contribution |
|---|---|---|---|---|---|---|---|---|
| Product demo | 5,000 | 500 | 150 | 50 | $3,500 | $1,400 | $300 | $1,100 |
| Creator review | 8,000 | 400 | 100 | 25 | $1,750 | $700 | $500 | $200 |
| Brand story | 12,000 | 180 | 30 | 6 | $420 | $168 | $200 | -$32 |
The brand story has the most views and the weakest direct contribution.
That does not automatically mean it should be deleted. It may serve an awareness function.
But do not call it a revenue winner.
Diagnose the Constraint
High impressions, low views
Fix:
- Placement
- Thumbnail
- Load speed
- Play control
- Relevance
High views, low product clicks
Fix:
- Product visibility
- Product tags
- CTA
- Video-product match
- Product timing
High clicks, low carts
Fix:
- Product page
- Price
- Variants
- Availability
- Shipping
- Offer
High carts, low purchases
Fix:
- Checkout
- Trust
- Delivery
- Payment options
- Unexpected costs
Strong revenue, weak gross profit
Fix:
- Product mix
- Discounts
- COGS
- Returns
- Creator cost
- App cost
Strong profit, low scale
Pull the More lever:
- Add the winning video to more relevant pages.
- Produce variations of the winning format.
- Increase qualified traffic.
- Repurpose the video across related campaigns.
Do not launch a completely new strategy before scaling the working one.
A 30-Day Measurement Plan
Days 1–3: Establish the baseline
Record:
- Page traffic
- Cart rate
- Purchase rate
- AOV
- Net sales
- Gross profit
- Device split
Days 4–7: Configure tracking
Confirm:
- Video impressions
- Views
- Clicks
- Carts
- Product IDs
- Purchase data
- Product costs
- Pixel behavior
Days 8–21: Run the test
Avoid unnecessary changes to:
- Price
- Promotion
- Product page
- Traffic
- Video
- Widget placement
Days 22–27: Diagnose the funnel
Find the largest drop-off.
Days 28–30: Calculate economics
Calculate:
- Attributed orders
- Attributed net sales
- Attributed gross profit
- Incremental gross profit where possible
- Total video cost
- Contribution
- Return on video investment
Then make one decision:
- Scale
- Improve
- Reposition
- Replace
- Remove
Frequently Asked Questions
How do I track shoppable video revenue on Shopify?
Track video views, product clicks, add-to-cart events, checkout starts, purchases, net sales, and gross profit. Connect app analytics with Shopify Analytics, customer events, or GA4.
Does Shopify automatically attribute sales to videos?
Not necessarily. Shopify tracks commerce and marketing data, but video-specific attribution depends on the app, event implementation, and reporting setup.
Does Hyper Shoppable Videos track purchases?
Its current public Shopify App Store listing states that it tracks video views, product clicks, and add-to-cart events. Verify current in-app functionality before assuming purchase-level attribution.
What is the most important shoppable video metric?
Gross profit created by the video is the most important economic metric. Product clicks and add-to-cart rate are useful diagnostic metrics.
Should I measure revenue or gross profit?
Measure both, but use gross profit to evaluate economic value. Revenue does not account for product cost.
How do I calculate video add-to-cart rate?
Divide video-attributed add-to-cart actions by video views and multiply by 100.
How do I calculate return on video investment?
Subtract total video cost from video-attributed gross profit, divide the result by total video cost, and multiply by 100.
What is a video-assisted purchase?
A video-assisted purchase occurs when a shopper interacts with a video and purchases later, rather than immediately during the same session.
Which attribution model should I use?
Use direct or last-click attribution for conservative reporting, and compare it with first-click, assisted, or linear views to understand broader influence.
How long should the video attribution window be?
The correct window depends on the product's normal buying cycle. Low-cost impulse products may use a shorter window, while expensive considered purchases may need 14 or 30 days.
Can GA4 track shoppable video events?
Yes, when the video app or custom implementation sends consistent events and parameters into GA4. Shopify also supports automatic collection of certain ecommerce events after GA4 is configured.
Why do app analytics and Shopify orders disagree?
Possible causes include different attribution windows, event definitions, consent, script blocking, duplicate events, cross-device journeys, returns, or delayed purchases.
How many visits do I need before evaluating a video?
There is no universal number. Small stores can use a four-week directional test, while larger stores should use controlled A/B testing and statistical analysis.
Should I count every purchase made by a video viewer?
No. Some customers would have purchased without video. Use a control group or baseline comparison to estimate incremental impact.
Final Checklist
Before reporting shoppable-video revenue:
- Define one primary business question.
- Record a baseline.
- Confirm how views and impressions are defined.
- Track product clicks.
- Track video-attributed add-to-cart actions.
- Connect checkout and purchase events.
- Use net sales rather than inflated gross sales.
- Record product costs.
- Calculate gross profit.
- Include app, production, creator, and staff costs.
- Compare direct and assisted attribution.
- Run a controlled test where possible.
- Check pixels for missing or duplicate events.
- Respect customer privacy and consent.
- Diagnose the largest funnel drop-off.
- Scale only after the economics work.
The reporting hierarchy is:
Views
< Clicks
< Carts
< Purchases
< Net sales
< Gross profit
< Incremental gross profit
Views tell you who watched.
Incremental gross profit tells you whether the video made the business better.
Explore Hyper Shoppable Videos on the Shopify App Store.
Sources
- Shopify Developer Documentation: Web Pixels Standard Events
- Hyper Shoppable Videos on the Shopify App Store
- Shopify Developer Documentation: Product Added to Cart Event
- Shopify Developer Documentation: Checkout Completed Event
- Shopify Help Center: Sales Reports
- Shopify Help Center: Finance Reports and Gross Profit Data
- Shopify Help Center: ShopifyQL Attribution Models
- Shopify Help Center: Overview of Shopify Reports
- Shopify Help Center: Acquisition Reports
- Shopify Help Center: Setting Up Google Analytics 4
- Shopify Developer Documentation: Web Pixels API
- Shopify Help Center: Testing App Pixels
- Shopify Help Center: Understanding Customer Privacy Settings